How to Optimize Your Dealership Photo Operations with Photographer Analytics
TL;DR:
Your photo capture workflow gets cars listed. Photographer analytics give dealership GMs and principals the data to track team output, spot quality gaps, and coach photographers across every rooftop. Here is what to measure, how to use the data, and where to find it in your CarCutter Hub.
You already have a photo workflow. Your team captures vehicles, the images get processed, and your listings go live. But here is the question most dealership leaders cannot answer: how well is that workflow actually performing?
CDK Global data shows that nearly 90% of shoppers start their buying journey based on the quality of photos on a dealer’s website. And according to Dealer.com, new car listings with actual photos are 30% more likely to generate a lead, rising to 40% for used and certified vehicles.
The photos matter. But without performance data behind your dealership photo operations, you are relying on assumptions instead of answers. Photographer analytics change that.
This article will help you understand what to measure, how to use performance data to improve consistency across your team, and how to do it without turning your operation into a surveillance system.
Why Your Photo Workflow Deserves Performance Data Behind It
Getting photos taken is table stakes. The real operational question is whether your photo team is performing consistently, efficiently, and at the quality level your listings demand.
Most dealerships have no clear answers to basic questions:
- How many photos is each photographer taking per day?
- What percentage of images get rejected or need retakes?
- Are all rooftops hitting the same quality standard?
- How long does it take from capture to listing?
Without this data, you cannot distinguish between a photographer who nails it every time and one who creates rework. You cannot tell if your best-performing location is carrying the rest of the group. And you certainly cannot coach anyone based on gut feeling alone.
CDK Global also notes it costs dealers as much as $50 for every day a vehicle is not merchandised. If slow or inconsistent photo operations are delaying your listings, that cost adds up fast across your inventory.
The shift is straightforward: move from “photos are getting done” to “photos are getting done right, everywhere, every time.”
The 5 Metrics That Show How Your Photo Team Is Really Performing
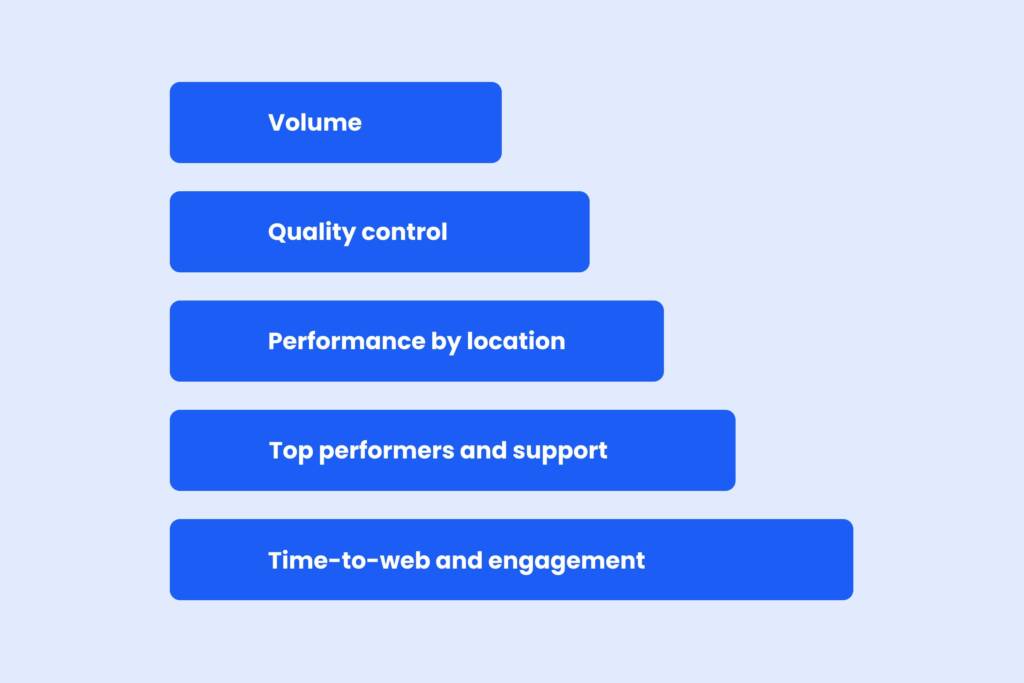
Strong dealership photography management comes down to tracking the right numbers. Here are the 5 metrics that matter most:
- Photos per photographer. Volume and consistency. Is each team member pulling their weight, and is output stable day to day?
- Rejection and retake rates. The clearest quality signal you have. A high rejection rate points directly to a training opportunity.
- Performance by rooftop. Are all locations meeting the same standard? For multi-rooftop groups, this is where inconsistency hides.
- Individual vs. company averages. How does each photographer compare to the group baseline? This highlights both top performers and those who need support.
- Time-to-web. The speed from photo capture to the listing going live. Faster time-to-web means more shopper engagement sooner.
Tracking these manually with spreadsheets falls apart the moment you scale beyond 1 location.
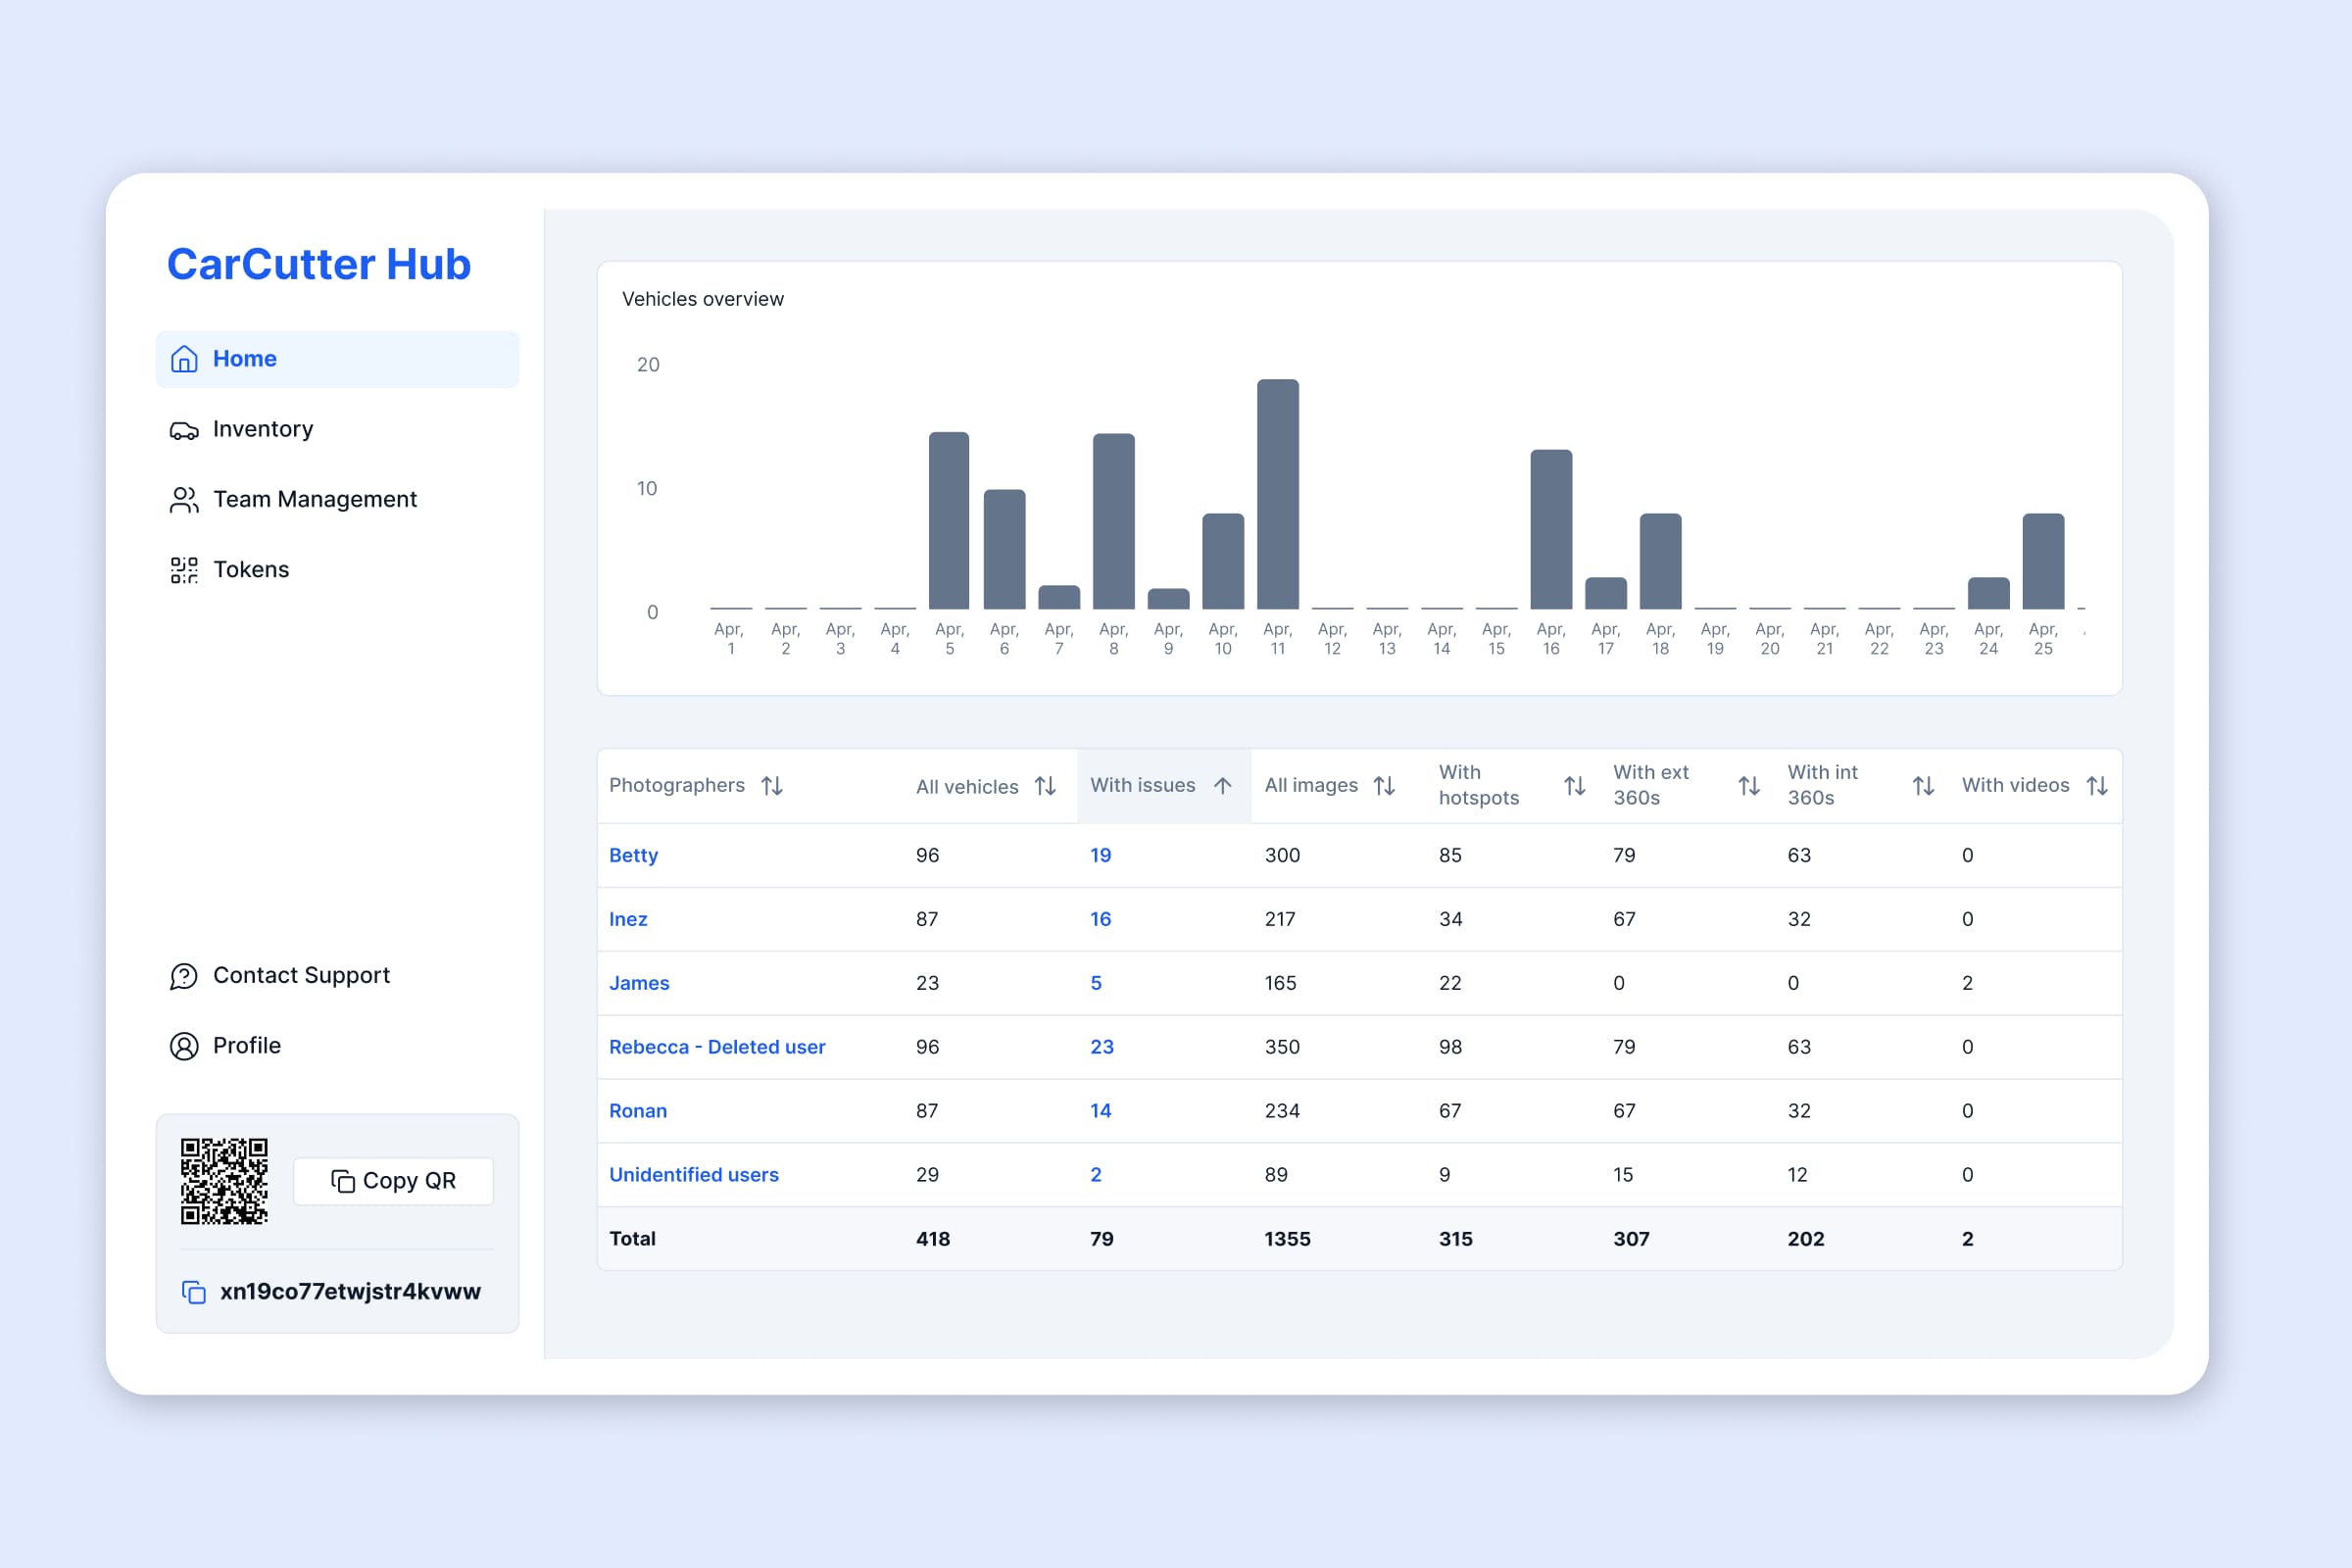
CarCutter’s Photographer Analytics feature, built into the CarCutter Hub, tracks all 5 of these automatically. Every capture session logged through the CarCutter app feeds directly into a centralized dashboard where you can filter by photographer, rooftop, and time period.
Because CarCutter also offers guided capture and real-time AI quality checks, your team starts each session with a clear standard. That means fewer rejections at the source and cleaner data to analyze.
Turning Data Into Better Coaching, Not Surveillance
Let us address the concern head-on: tracking photographer performance can feel like policing if it is handled poorly.
The difference comes down to intent and transparency. Photographer analytics are a coaching tool, not a surveillance system. Here is how the best dealership leaders use this data:
- Make the data visible to the team. Let photographers see their own numbers. People improve faster when they can track their own progress.
- Lead with curiosity. If rejection rates are high, ask “What is getting in the way?” before anything else.
- Identify training needs early. A photographer who consistently struggles with the same type of shot needs guidance, not a warning. With the data in front of you, that conversation becomes specific and constructive.
- Celebrate improvement. When numbers go up, say so. Data makes wins visible alongside the gaps.
Frame it the same way you frame service department efficiency or sales conversion rates. Photography is just another part of the business that benefits from clear metrics.
If you want to see how your team is performing right now, access your CarCutter Hub and explore Photographer Analytics.
Scaling Consistency Across Every Rooftop
For single-store operators, keeping an eye on photo quality is manageable. For multi-rooftop dealer groups, it becomes a different challenge entirely.
CarCutter’s Photographer Analytics lets you compare rooftop performance side by side from the CarCutter Hub. That means you can:
- Spot which locations are falling behind on quality or speed before it affects your listings.
- Identify whether a problem is photographer-specific or location-wide, so you apply the right fix.
- Allocate your best people where they are needed most, based on actual data instead of assumptions.
- Standardize output across the group by pairing analytics with guided capture and consistent shot lists.
When every location uses the same capture workflow and the same reporting layer, your inventory photo operations scale without sacrificing the quality your shoppers expect.
Key Takeaways
Dealership photo operations do not optimize themselves. Data does.
- Track the 5 metrics that matter: volume, quality, rooftop consistency, individual performance, and speed.
- Use the data to coach your team, not to police them. Transparency and curiosity go further than pressure.
- Standardize the input with guided capture so quality starts at the source.
- Centralize reporting with CarCutter’s Photographer Analytics in the Hub so you can manage every rooftop from 1 dashboard.
Your dealership photo operations are a competitive advantage when they are measured and managed. Photographer Analytics gives you the visibility to make that happen.
Access your CarCutter Hub to explore Photographer Analytics. Not using CarCutter yet? Book a demo to see it in action.
Dealership photo operations cover the full workflow of capturing, editing, quality-checking, and publishing vehicle photos for online listings. Effective photo operations ensure every car is presented consistently and listed quickly across all locations.
hotographer analytics is a reporting feature that tracks each photographer’s output, quality rates, and performance across dealership locations. It gives management the data to coach teams, maintain standards, and make smarter operational decisions.
CarCutter Hub’s Photographer Analytics automatically logs photos per photographer, rejection rates, and performance by rooftop. You get a clear, real-time view of your photo operation without manual spreadsheets or guesswork.
Yes. CarCutter’s Photographer Analytics is built for multi-location operations, letting you compare performance across all your rooftops from a single centralized dashboard in the Hub.
Not when rolled out with transparency. The most effective leaders use analytics as coaching tools, sharing data openly and using it to identify training opportunities rather than assign blame.
he 5 key metrics are photos per photographer, rejection and retake rates, performance by rooftop, individual vs. company averages, and time from capture to listing going live.
CarCutter’s mobile app provides guidance and real-time AI quality checks during capture. This helps photographers meet the standard on the first attempt, reducing rejections and giving analytics cleaner data to work with.
Most dealerships notice patterns within the first few weeks. Common early wins include identifying specific training needs, equalizing output across locations, and reducing retake rates.